Monitor service statistics
You can retrieve and monitor detailed statistics information on a service.
The icon is only accessible when a Live encoding servive is associated to a server and then running.
-
From the Services page, identify the service that you want to monitor and click the related icon. The Statistics page displays.
-
You can navigate between three tabs:
You can customize the information displayed such as activating or deactivating the auto refresh by clicking the Auto refresh button.
Media info
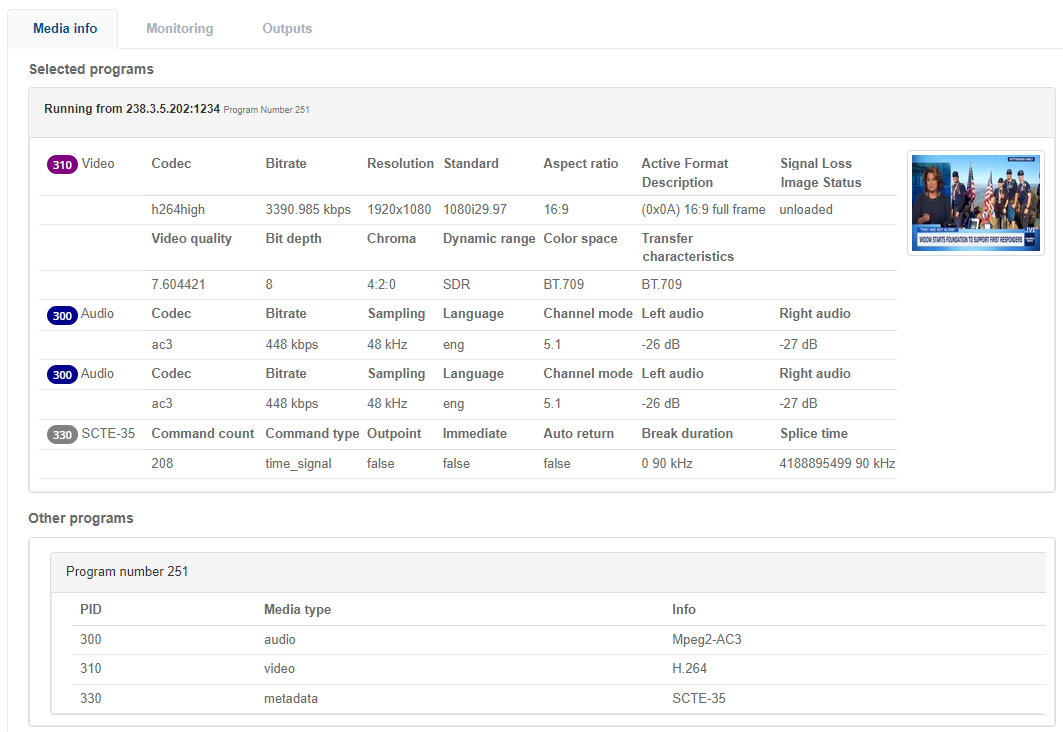
From the Media info tab, you can view the following information for each program:
- Video statistics
- Audio statistics
- Preview of the video
- List of other available programs
 Example of Service Statistics>Media info
Input monitoring
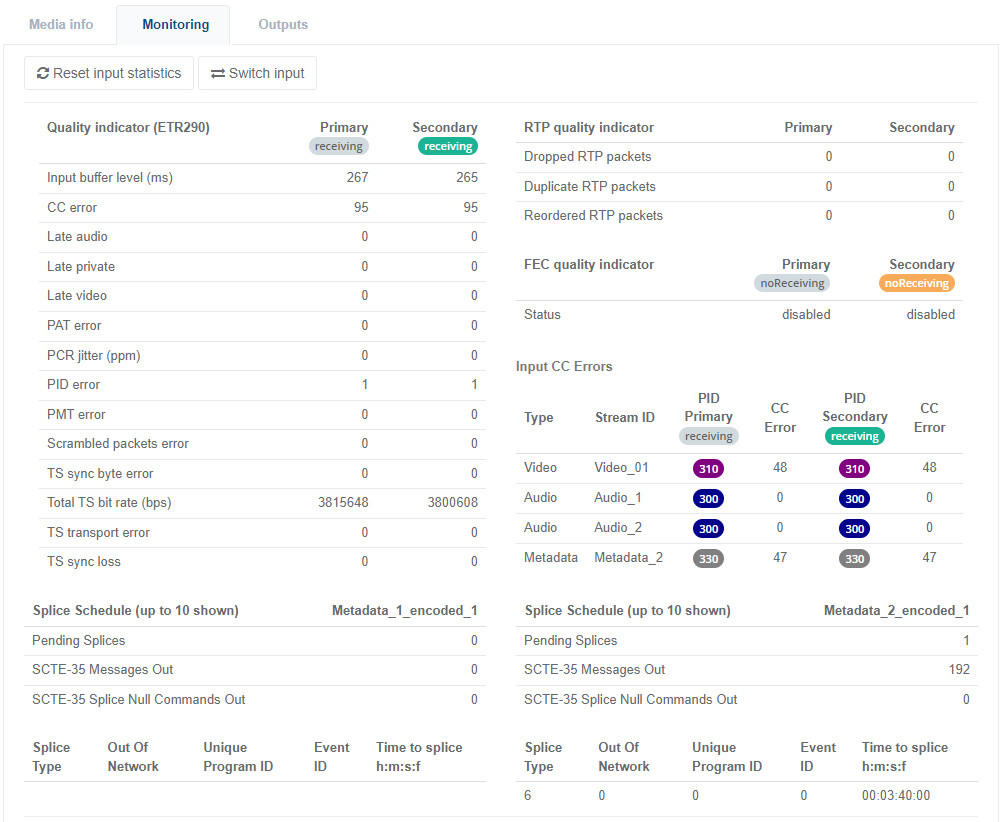
From the Input monitoring info tab, you can view the following information:
- Quality indicators (ETR290)
- RTP quality indicators
- FEC quality indicators
- Input CC Errors
- Splice schedule
 Example of Service Statistics>Input monitoring
Outputs
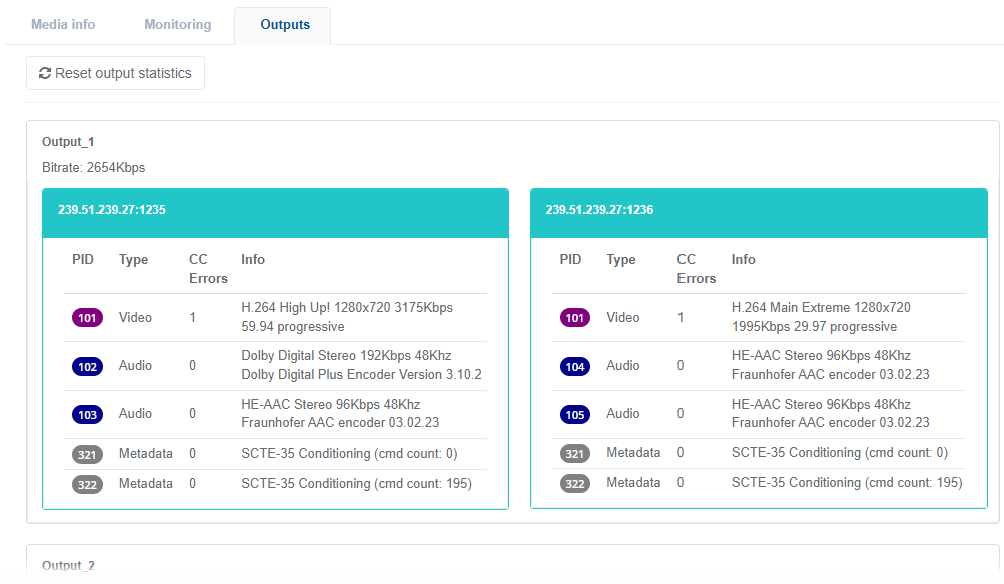
From the Outputs tab, you can view the following information for each output:
- PID number
- Media type (audio, video, subtitles, metadata)
- CC errors
- Information
 Example of Service Statistics>Output monitoring
-
Once you have configured an automated blackout and started a service, you can manually activate or deactivate the blackout.
-
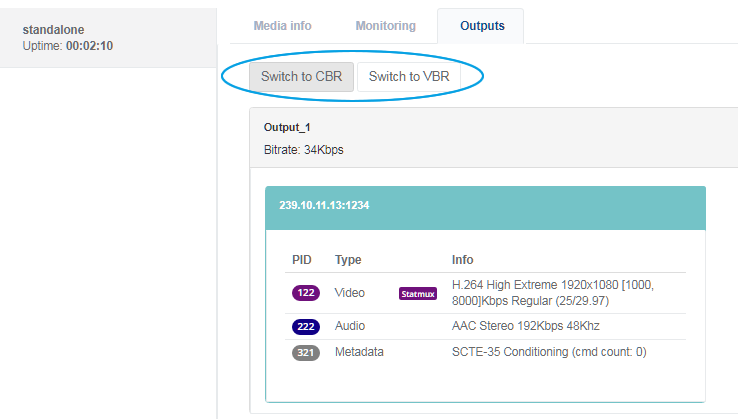
Once you have activated and configured the Switch to CBR option, and started the service, you can manually switch from Statmux to CBR (Switch to CBR button) or switch back from CBR to Statmux (Switch to Statmux button).
 Example of Service Statistics>Outputs with Switch to CBR option activated