Beam Essentials UI
The Essentials UI is a simplified operating view for MK.IO Beam devices, designed for day to day monitoring and channel control. Use it to check channel health at a glance, review active alarms, and create new channels without configuring the underlying services directly.
You can access a device’s Essentials UI locally at the device address, or remotely through MK.IO. For remote access, see Access the remote device UI.
The MK.IO Beam Essentials UI requires Beam version 1.12.0 or higher, and is only available for new customers or fresh Beam ISO installations.
The Essentials UI also introduces the Channels API. This API presents everything the device is doing as a number of channels, where one channel can cover the input, the processing, and the output of a single service. It is the API behind the Beam Essentials UI, and it runs on the device.
For more information and user guides see: Channels API guides
Essentials and Advanced views
Section titled “Essentials and Advanced views”The device UI is split into two views, available from a toggle in the top right corner of the header.
- Essentials: day to day operations and monitoring. Channels are presented as a single unified concept, with live thumbnails and clear status.
- Advanced: deeper engineering and service level configuration, exposing the underlying services, alarms, servers, and templates that power each channel. See Advanced interface overview for Advanced view documentation.
Both views operate on the same underlying system. Advanced gives full configuration access at the service level, while Essentials presents that configuration as unified channels.
A device presents one or the other, never both. A device with the Essentials view manages workflows as channels, and a device without it manages them as feeds. If the documentation you are reading refers to feeds, you are in the wrong set of pages: see Advanced interface overview.
Switch to the Advanced interface
Section titled “Switch to the Advanced interface”The Essentials and Advanced buttons sit together in the top right of the header, next to the help and account icons. The current view is the highlighted one.
Select Advanced when you need something the Essentials view does not cover, such as reception and gateway configuration beyond the channel wizard, service level settings, servers, or templates. Select Essentials to come back.
Both views act on the same device, so a change made in one is visible in the other.
The first time you open the Essentials view, a welcome dialog introduces the interface, with links to a short video and to this documentation.
Dashboard
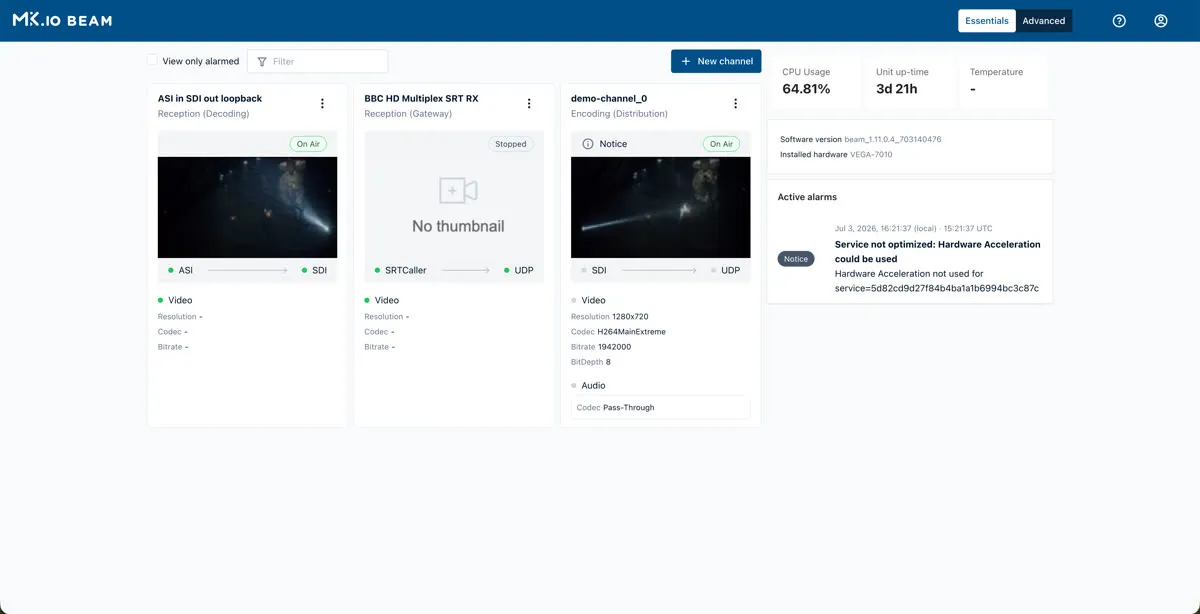
Section titled “Dashboard”Opening a device in the Essentials view displays the dashboard, showing every channel running on that device.
Quick controls
Section titled “Quick controls”Below the header, the dashboard provides:
- View only alarmed: a toggle that filters the dashboard to show only channels that currently have alarms.
- Filter: a search field to filter the channel list by name.
- New channel: opens the channel creation wizard. See Create a channel, or Create a reception channel for the Reception (Decoding) workflow.
Status panel
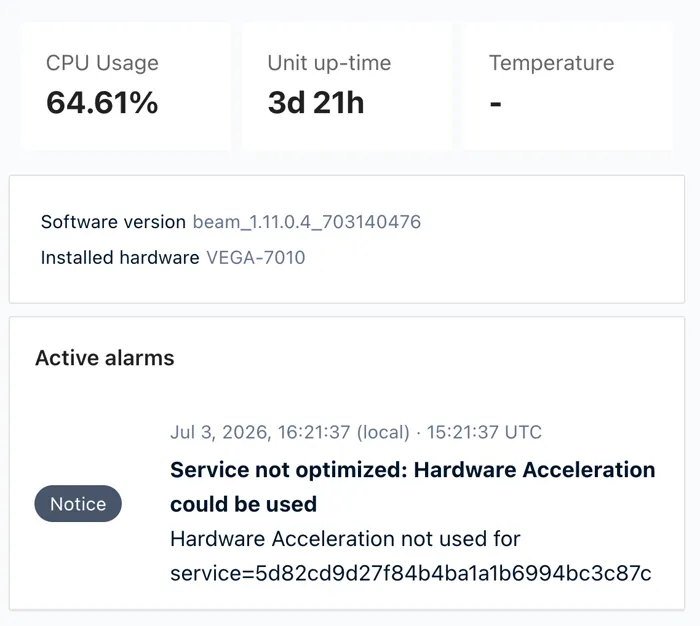
Section titled “Status panel”In the top right of the dashboard, three summary metrics show the device’s current load: CPU Usage, Unit up-time, and Temperature. A dash in place of a value means that reading is not available on this device.
Below the summary metrics, a second panel identifies the device: Software version and Installed hardware.
Active alarms panel
Section titled “Active alarms panel”Below the status panel, the active alarms panel lists every active alarm across the device, sorted by alarm severity and recency. Each entry shows a timestamp, a severity badge, a title, and a description of the fault, usually including the affected service name.
Severity levels are Critical, Major, and Notice. For a full breakdown of alarm types and how to configure alarm overrides, see Manage alarms.
Channel cards
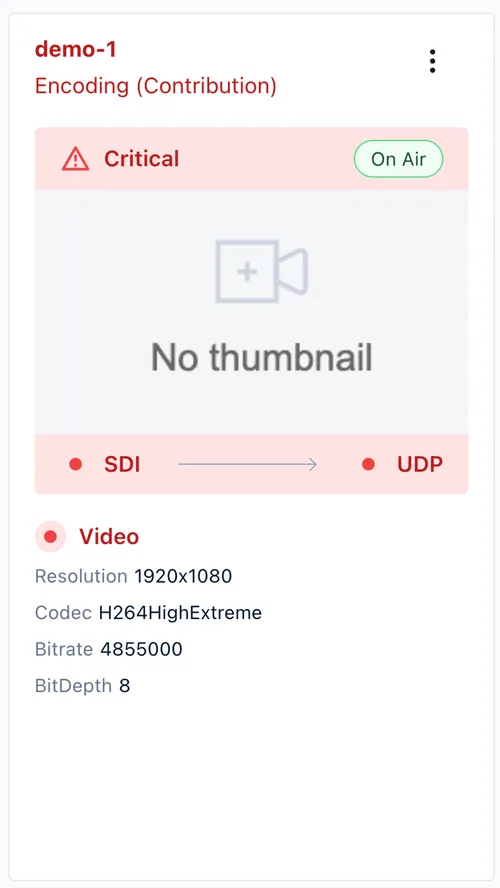
Section titled “Channel cards”The channel card grid is the main part of the dashboard. Each card represents a channel on the device and shows:
- Its On Air or Stopped status, and a live video thumbnail when it is on air and healthy (a stopped or unhealthy channel shows No thumbnail instead).
- Its Video parameters (resolution, codec, bitrate, and bit depth) and Audio parameters (codec, and mode and bitrate where applicable).
- A signal diagram showing the input and output type for the channel, for example SDI into UDP, or ASI into SDI, connected by a line of status dots.
When a channel has an active alarm, the card makes it clear:
- The thumbnail area shows a severity badge, for example a red Critical badge.
- The card background and the signal diagram dots turn red or orange to match the alarm severity.
View channel details
Section titled “View channel details”Select a channel card to open its detail view.
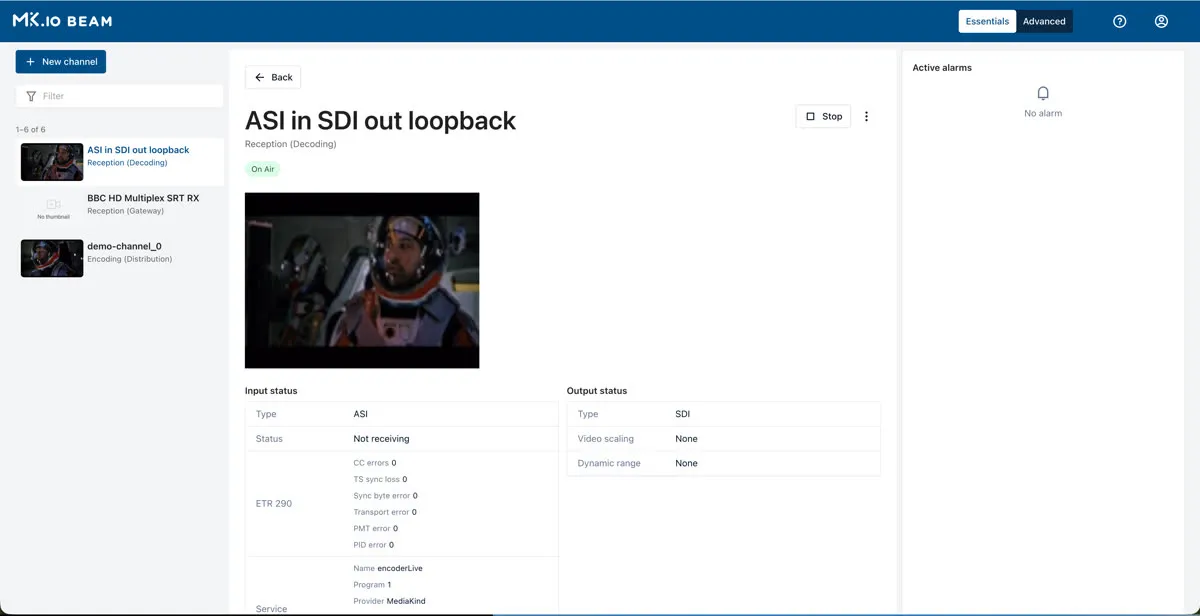
At the top of the page, you can see the channel name, its workflow label, and its status.
- Select Stop to take the channel off air.
- Select the three dot menu for additional actions.
- Use the channel selector on the left to move to a different channel without returning to the dashboard.
Below the video preview, Input status and Output status report the live condition of the channel:
- Input status shows the input Type and Status (for example Not receiving), and Service identification.
- Output status shows the output Type, and its Video scaling and Dynamic range settings.
The active alarms panel on the right stays scoped to the selected channel, and shows No alarm when the channel is healthy.
Edit channel settings
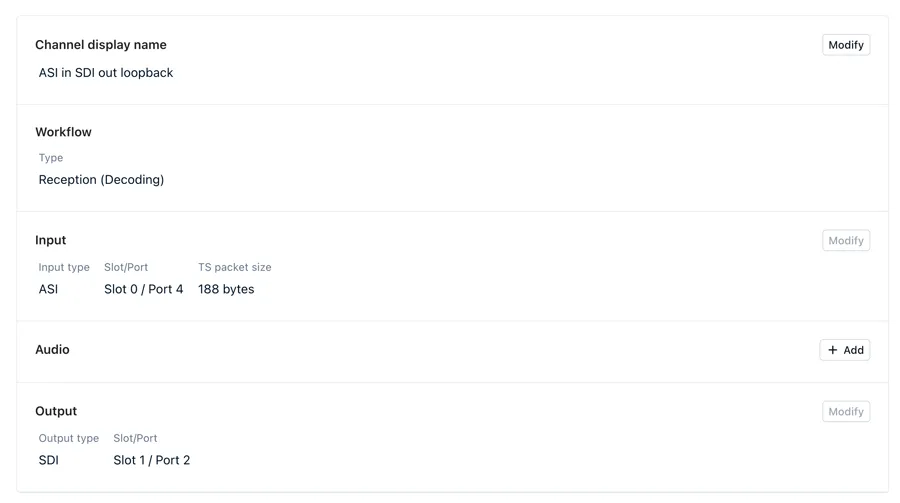
Section titled “Edit channel settings”From a channel’s detail view, use the three dot menu to open its settings. Each section lists the channel’s current configuration, with an independent Modify button:
- Channel display name
- Workflow: the channel’s type, for example Reception (Decoding).
- Input: input type, slot or port, and TS packet size.
- Audio: configured audio tracks, with an + Add button for adding another.
- Output: output type, and slot or port.