Manage alarms and events
Alarm icons and alarm state descriptions
Alarm icons use a color code to indicate levels of severity. Alarms may trigger different automatic system responses, like failover. Certain intended, manual actions may trigger a notification event, like when you manually start or stop a service.
Color codes for alarm and event states:
-
Alarms
- critical
- major
- minor
- information
-
States
State Description raised An alarm is active and triggered. Service may be stopped or the server is down. A backup server may be used if assigned in a failover group cleared The issue related to the alarm is resolved. This includes restoring services after a failover to a backup server, even if the primary server is down.
Customize alarm display time
The alarm display refreshes automatically every few seconds. By default, all timestamps are shown in Universal Time (UTC), but you can customize the time zone.
- Click in the upper right corner.
- Select Settings.
- In the General tab, choose your preferred Alarm display time zone from the drop-down list.
- Click Save to apply the changes.
Types of alarms
Different pages are dedicated to specific alarm displays. For example, the Alarms page is a centralized alarm overview, the Service alarms page displays alarms for the specific service, and the Failover alarms page displays alarm and event overviews.
Alarms page
The alarms page centralizes all alarms and events into a table. The Alarms page is a general alarms overview.
See the Service alarms page or the Failover alarms page for specific alarm information.
Display all alarms and events
The Alarms page is an overview of all alarms and events.
To access the Alarms page you can:
-
Click Alarms on the left-side menu to access all Active alarms, Alarm history and Alarm overrides.

-
Click Services on the left-side menu then click in the Alarm column to display alarms for a specific service. The Alarm icon is the color of the active alarm with the highest level of severity.
-
Use the shortcuts in the top-right corner banner.

You can then use the sort options in the table headers or the search bar to filter on specific alarms, services or servers.
Display alarm history
The alarm history for all alarms displays in a tab in the Alarms page.
By default, the alarm history is stored for approximately 7 days, or a maximum of 100,000 alarm events.
- Click Alarms from the left-side menu.
- Click Alarm History to view the history for all alarms.
- Use the sort options in the table headers or the search bar to filter on specific alarms, services or servers.
- The Auto refresh button can be used to control whether new alarms automatically appear in the table. This can be useful to disable on a busy system to stop the screen scrolling.
- Click the Download history button to download a .csv file containing the alarm history.
Service alarms page
You can access the alarms for a specific service from the Services page. An icon in the Alarms column indicates that there is at least one alarm for the service. Alarm icons use a color code. The color of the alarm icon in the Alarms column is based on the highest severity alarm known for that service.
An alarm status icon displays per service in relation to the alarm with the highest severity for that service. More than one alarm may exist for a single service.
Display service-specific alarms page
The service-specific alarms display in a dedicated page that also displays the alarm history for the service.
- Display Services.
- Click the alarm icon in the Alarms column. The service alarms display.
Failover alarms page
If a failover group exists, then certain critical alarms may trigger a failover. You can check alarms for failover groups, and then drill down to alarms to investigate servers and related services.
In the Failover group page, the alarm with the highest severity (in relation to the servers in the failover group) displays in the Alarm Status column.
The alarm display is automatically refreshed every few seconds. All time stamps are in Universal Time (UTC).
Display failover alarms page
The failover alarms page displays alarms and the alarm history for servers in a failover group.
- Display the Failover page from the left-side menu panel.
- Click the alarm icon in the Alarm Status column.
The alarms for the failover group display. You can use failover alarms to determine if a server in the failover group has an alarm, and then if there are service alarms for services running on that server.
Alarm forwarding (SNMP)
SNMP alarm forwarding requires you to define a destination where alarms are sent.
Display the list of SNMP destination configurations
-
Click in the upper right corner of the window.
-
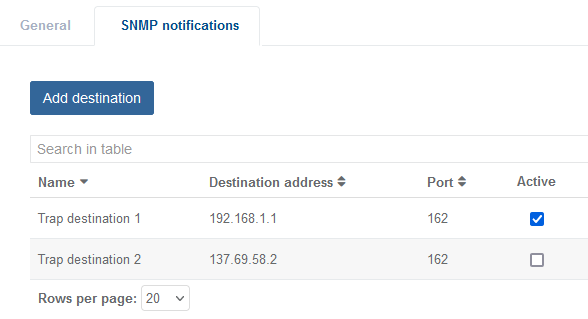
Select Settings then click the SNMP notifications tab. The SNMP destinations display. You can use the search options or column filters to browse the SNMP notification configurations.
Add a new SNMP destination
- Click in the upper right corner of the window then select Settings.
- From the SNMP notifications tab, click Add destination. The SNMP destination parameters display.
- Enter the SNMP parameters to configure the destination and the version.
The parameters that display to edit SNMP destinations depend on the SNMP version.
- Save settings to return to the list of SNMP configurations.
Edit SNMP destination configurations
- Click in the upper right corner of the window then select Settings.
- From the SNMP notifications tab, click to display SNMP destination parameters.
- Edit the SNMP parameters and save.
The parameters that display to edit SNMP destinations depend on the SNMP version.
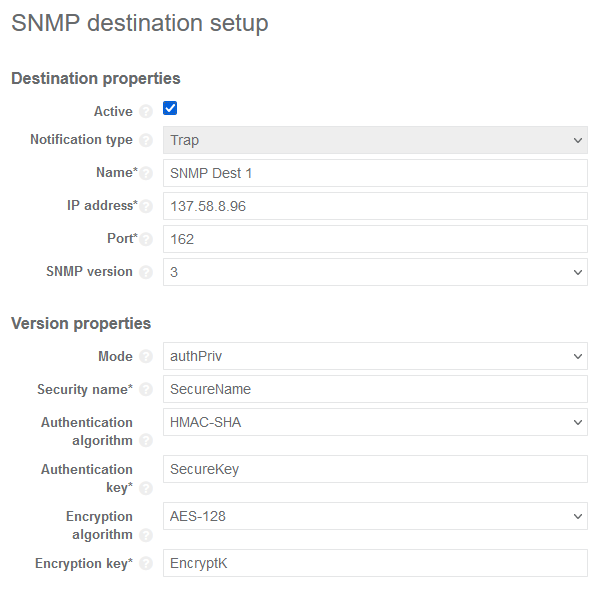 Example of SNMP v3 configuration
Activate/deactivate SNMP notifications
- Click in the upper right corner of the window then select Settings.
- From the SNMP notification tab, you can activateSNMP notifications either:
- tick the Activate checkbox from the table where SNMP configurations are listed.
- or click and tick the Activate checkbox at the top of the SNMP parameters.
Delete an SNMP destination server
- Click in the upper right corner of the window then select Settings.
- From the SNMP notifications tab, click to delete the SNMP destination configuration. You are prompted to confirm and delete.
Alarm overrides
The alarm overrides feature requires specific user rights.
You can manually override alarm severity levels. You can also view the alarms that trigger failover. You can filter the alarms using the search bar.
Changing the Triggers failover value impacts the possibility of a failover occurring.
Override an alarm severity
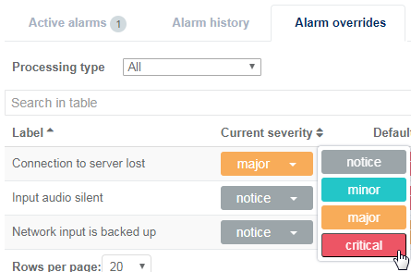
You can change the alarm severity to either critical, major, minor, notice or ignore. The initial default severity displays in the Alarm overrides tab if you need to revert to the initial default severity setting. Setting an alarm to "ignore" will exclude that alarm type from displaying in the active and historical alarm views. It will also be excluded from the API responses and SNMP traps. The only evidence of "ignored" alarms will be in log files.
Changes to severity are only applied to future occurrences. Any current or previously existing alarms are unchanged.
-
Click Alarms in the left-hand menu panel.
-
Click the Alarm overrides tab to display options. The following page displays.

-
Click the Current severity for the specific alarm to display options. A list of severity options displays.
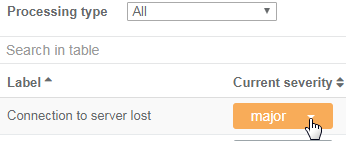
-
Select a severity from the list. The Current severity changes.
Changing the severity may increase or decrease the possibility of failover occurrence.
Reset the alarm severity to the default setting
Alarm severity can be manually changed. You can reset the alarm severity to the default setting. Changing the Triggers failover value impacts the possibility of a failover occurring.
Changes to severity are only applied to future occurrences. Any current or previously existing alarms are unchanged.
- Click Alarms in the left hand menu.
- Click the Alarm overrides tab to display options.
- Click the Default severity for the specific alarm to display options. A list of severity options displays.
- Select a severity from the list. The Default severity changes.
Changing the severity may increase or decrease the possibility of failover occurrence.
Events
Events are displayed in the Alarms page. Events notify you of actions that do not impede proper functioning.
Example of an event when you intentionally start or stop a service:
