Service Monitoring
Monitor service alarms
The MediaKind user interface allows you to access active and cleared alarms list for each service.
-
Go to the Services page.
-
Identify the service that you want to monitor and click the related icon in the info column.
Depending on the severity of the alarm, the will appear in different colors and will display the most severe color alarm in case of multiple alarms.
- red: critical alarm
- orange: major alarm
- blue: minor alarm
- grey: notice alarm
The following page displays.

From this page, you can access the following information:
-
The active alarms table applied on the current server including:
- date and time of the alarm rise
- alarm description (label)
- alarm severity
- detailed information
-
The alarm history table including:
- date and time of the alarm rise
- alarm description (label)
- alarm status
- alarm severity
- server on which the service was applied when the alarm raised.
- detailed information
The alarm tables display up to 10 alarms per page. Use the arrows or page number at the bottom of the table to navigate through the complete alarms list.
Monitor service statistics
When a multiplexer configuration is running, you can retrieve and monitor on MediaKind user interface detailed statistics information.
-
From the Services page, identify the service that you want to monitor and click the related icon in the Stats column.
The is only accessible when an encoder configuration is associated to a server and then running.
The Statistics page displays.
-
You can navigate between two tabs: Overview and Input.
Overview
From the Overview tab, you can view the following information for each program:
- Multiplexer Graphs (one graph per processing server)
- Multiplexer statistics:
- MPTS Output
- Active/Passive state of the IP output
- Info
- Bitrate (in bps)
- FEC Bitrate (in bps)
- CC errors
- Dropped packets
Additionally, the following actions can be taken in this page:
- Customise the data displayed in the graphs by clicking the labels in the graph legend.
- Customise the information displayed such as activating or deactivating the input statistics by clicking the toggle button Inputs displayed.
- View detailed per PID information by expanding the available information in the Multiplexer Statistics table using the arrow buttons under the MPTS Output column.
- Reset the current statistics displayed in Multiplexer Statistics table using the buttons under the Actions column.
- Change the active Mux, when Active/Standby mode has been enabled, using the buttons under the Activate column.

Statistical bit rate allocation
The Statistical bit rate allocation tab is only available when statmux is enabled at the service level.
From the Statistical bit rate allocation tab, you can view the following information for each program:
-
Statmux pool graph
Display options:
- Select the statmux pool to display amongst the pools available.
- Select the type of view to display (Line graph or Pool bitrates).
- Select the video and audio components to display on the graph (all are activated and visible by default).
-
Statmux pool table
The table shows the active/passive status of the servers used for the statmux setup.
- Click the button in the Actions column to change the active server:
- Click the button in front of the server line to cause it to become active for all statmux pools.
- Click the button in front of a statmux pool to activate it in the corresponding server.
- Click the button to display detailed information about the statmux group:
- Service name or ID
- Codec
- Priority
- Bit rate (min/max)
- Resolution
- Total bitrate
- Video bitrate
- Audio bitrate
- Private bitrate
- Click the button in the Actions column to change the active server:

Input
From the Input tab, you can view the following information:
- Input sources information, especially service name, input source IP address and Multiplexer IP address.
- RTP quality indicators
- FEC quality indicators

Tip: You can refresh the statistics displayed by clicking the ![]() button.
button.
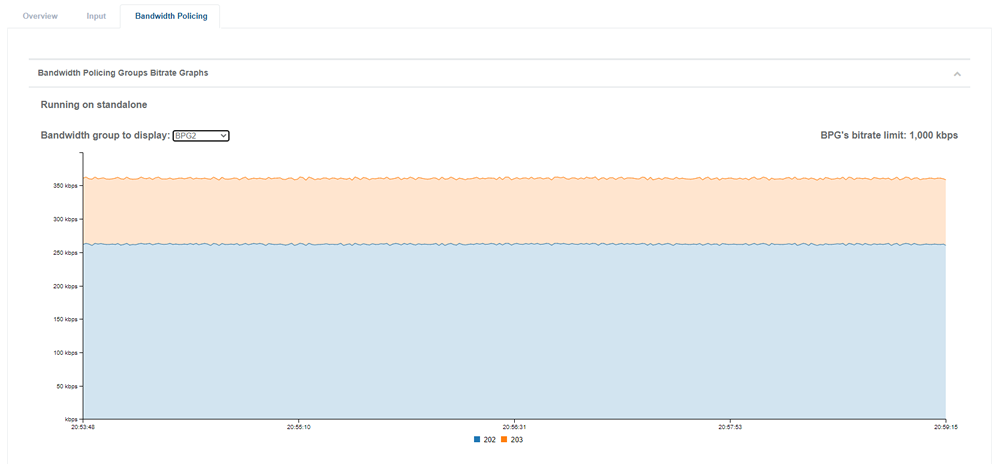
Bandwidth Policing
From the Bandwidth Policing tab, you can view the following information:
-
Bandwidth Policing Groups Bitrate Graphs.

The page will display 1 or 2 graphs depending on the number of servers assigned for the given service.
Tip: You can filter the information displayed by selecting the Bandwidth Policing Group and the PID to display.
-
Bandwidth Policing Groups Statistics.

Tip: You can refresh the statistics displayed by clicking the ![]() button.
button.