Service Monitoring
Monitoring service alarms
Section titled “Monitoring service alarms”The user interface allows you to access active and cleared alarms list for each service.
-
From the services page, identify the service that you want to monitor.
-
Click the related
'%3e%3cpath%20d='M16.3092%2012.0018L10.7682%201.96739C10.344%201.19552%209.27348%201.19552%208.84641%201.96739L3.308%2012.0018C2.88171%2012.7709%203.41267%2013.7385%204.26709%2013.7385H15.3491C16.2001%2013.7385%2016.7327%2012.7736%2016.3092%2012.0018ZM9.18359%205.1376C9.18359%204.77233%209.46285%204.47599%209.80705%204.47599C10.1513%204.47599%2010.4305%204.77371%2010.4305%205.1376V8.66617C10.4305%209.03143%2010.1513%209.32777%209.83043%209.32777C9.50961%209.32777%209.18359%209.03281%209.18359%208.66617V5.1376ZM9.80705%2011.9742C9.35608%2011.9742%208.99032%2011.5861%208.99032%2011.1075C8.99032%2010.6289%209.35582%2010.2408%209.80705%2010.2408C10.2583%2010.2408%2010.6238%2010.6289%2010.6238%2011.1075C10.6227%2011.5855%2010.2591%2011.9742%209.80705%2011.9742Z'%20fill='%23878787'%20fill-opacity='0.9'/%3e%3c/g%3e%3cdefs%3e%3cclipPath%20id='clip0_590_368'%3e%3crect%20width='19'%20height='17.5385'%20fill='white'%20transform='translate(0.307739)'/%3e%3c/clipPath%3e%3c/defs%3e%3c/svg%3e) icon in the info column.
icon in the info column.Depending on the severity of the alarm, the
will appear in different colors and will display the most severe color alarm in case of multiple alarms.'%3e%3cpath%20d='M16.0015%2012.0018L10.4605%201.96739C10.0363%201.19552%208.96574%201.19552%208.53867%201.96739L3.00026%2012.0018C2.57397%2012.7709%203.10493%2013.7385%203.95935%2013.7385H15.0414C15.8924%2013.7385%2016.4249%2012.7736%2016.0015%2012.0018ZM8.87585%205.1376C8.87585%204.77233%209.15511%204.47599%209.49931%204.47599C9.84352%204.47599%2010.1228%204.77371%2010.1228%205.1376V8.66617C10.1228%209.03143%209.84352%209.32777%209.52269%209.32777C9.20187%209.32777%208.87585%209.03281%208.87585%208.66617V5.1376ZM9.49931%2011.9742C9.04834%2011.9742%208.68258%2011.5861%208.68258%2011.1075C8.68258%2010.6289%209.04809%2010.2408%209.49931%2010.2408C9.95054%2010.2408%2010.316%2010.6289%2010.316%2011.1075C10.315%2011.5855%209.95132%2011.9742%209.49931%2011.9742Z'%20fill='%23ED5565'/%3e%3c/g%3e%3cdefs%3e%3cclipPath%20id='clip0_596_321'%3e%3crect%20width='19'%20height='17.5385'%20fill='white'/%3e%3c/clipPath%3e%3c/defs%3e%3c/svg%3e) : critical alarm
: critical alarm'%3e%3cpath%20d='M16.0015%2012.0018L10.4605%201.96739C10.0363%201.19552%208.96574%201.19552%208.53867%201.96739L3.00026%2012.0018C2.57397%2012.7709%203.10493%2013.7385%203.95935%2013.7385H15.0414C15.8924%2013.7385%2016.4249%2012.7736%2016.0015%2012.0018ZM8.87585%205.1376C8.87585%204.77233%209.15511%204.47599%209.49931%204.47599C9.84352%204.47599%2010.1228%204.77371%2010.1228%205.1376V8.66617C10.1228%209.03143%209.84352%209.32777%209.52269%209.32777C9.20187%209.32777%208.87585%209.03281%208.87585%208.66617V5.1376ZM9.49931%2011.9742C9.04834%2011.9742%208.68258%2011.5861%208.68258%2011.1075C8.68258%2010.6289%209.04809%2010.2408%209.49931%2010.2408C9.95054%2010.2408%2010.316%2010.6289%2010.316%2011.1075C10.315%2011.5855%209.95132%2011.9742%209.49931%2011.9742Z'%20fill='%23F8AC59'/%3e%3c/g%3e%3cdefs%3e%3cclipPath%20id='clip0_596_318'%3e%3crect%20width='19'%20height='17.5385'%20fill='white'/%3e%3c/clipPath%3e%3c/defs%3e%3c/svg%3e) : major alarm
: major alarm'%3e%3cpath%20d='M16.0015%2012.0018L10.4605%201.96739C10.0363%201.19552%208.96574%201.19552%208.53867%201.96739L3.00026%2012.0018C2.57397%2012.7709%203.10493%2013.7385%203.95935%2013.7385H15.0414C15.8924%2013.7385%2016.4249%2012.7736%2016.0015%2012.0018ZM8.87585%205.1376C8.87585%204.77233%209.15511%204.47599%209.49931%204.47599C9.84352%204.47599%2010.1228%204.77371%2010.1228%205.1376V8.66617C10.1228%209.03143%209.84352%209.32777%209.52269%209.32777C9.20187%209.32777%208.87585%209.03281%208.87585%208.66617V5.1376ZM9.49931%2011.9742C9.04834%2011.9742%208.68258%2011.5861%208.68258%2011.1075C8.68258%2010.6289%209.04809%2010.2408%209.49931%2010.2408C9.95054%2010.2408%2010.316%2010.6289%2010.316%2011.1075C10.315%2011.5855%209.95132%2011.9742%209.49931%2011.9742Z'%20fill='%2323C6C8'/%3e%3c/g%3e%3cdefs%3e%3cclipPath%20id='clip0_596_315'%3e%3crect%20width='19'%20height='17.5385'%20fill='white'/%3e%3c/clipPath%3e%3c/defs%3e%3c/svg%3e) : minor alarm
: minor alarm
The following page displays.
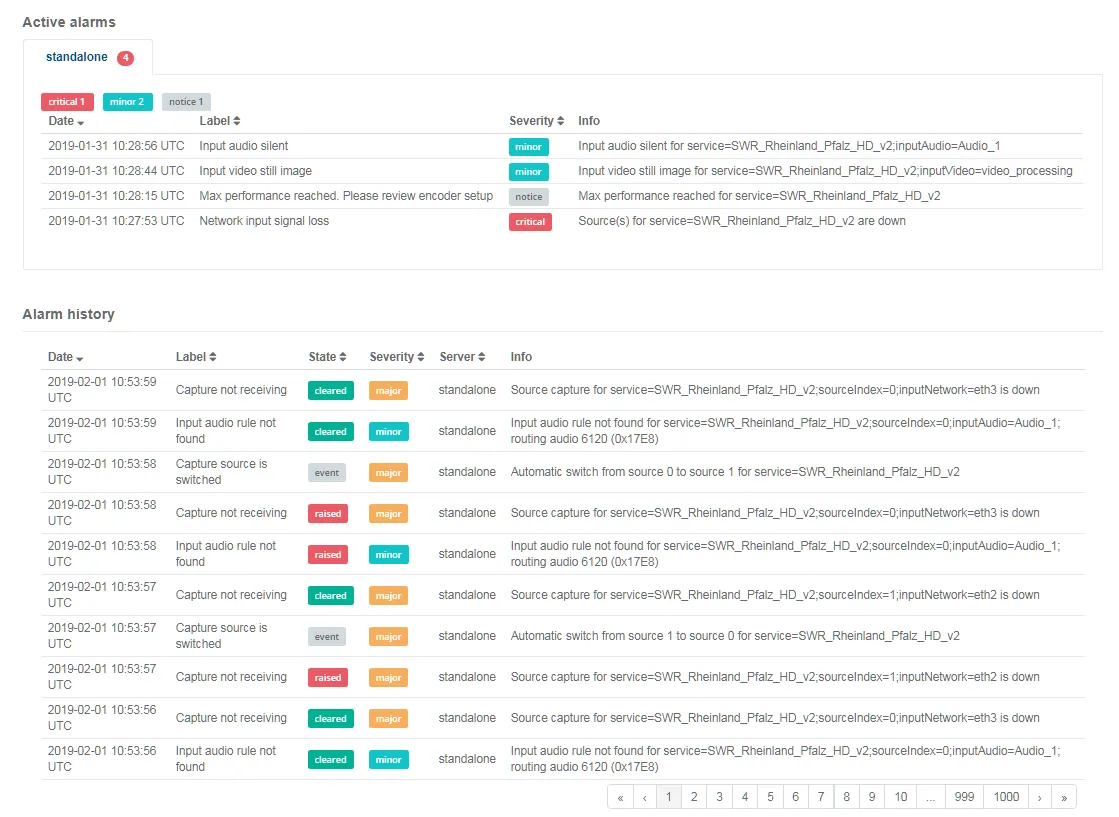
From this page, you can access the following information:
- The active alarms table applied on the current server including:
- Date and time of the alarm rise
- Alarm description (label)
- Alarm severity
- Detailed information
- The alarm history table including:
- Date and time of the alarm rise
- Alarm description (label)
- Alarm status
- Alarm severity
- Server on which the service was applied when the alarm raised.
The alarm history table displays up to 10 alarms per page. Use the arrows or page number at the bottom of the table to navigate through the complete alarms list.