Menus and navigation
User interface orientation
Features, menus and options vary depending on your product and the MediaKind components installed.
Home page and dashboard overviews
The Home page displays a dashboard with overviews for services, servers, templates and alarms. Click an overview to link to the related page.

Health indicator and alarms banner
The Health indicator and alarms banner displays in the upper right corner of the screen.
Health indicator status:
- Green: everything is OK.
- Amber: something needs attention.
- Red: something isn't working. Functionality could be limited. If the indicator is amber or red, alarms will also be triggered.
You can click the Health indicator or the Health left menu to display an embedded Grafana page showing an overview of Controller health.
System Center for solution administration
The System Center menu provides access to administration features. Administrators can manage users, system backups and restore options, as well as monitor servers, and manage settings.
To access the System Center, click the in the top right corner. The displayed menu includes a number of options for system administration and monitoring.
Features are available depending on your user rights.
| Group | Restore | Backup | User Management | Settings |
|---|---|---|---|---|
| Admin | Yes | Yes | R+W | Yes |
| Monitoring | No | Yes | N/A | Yes |
| Configuration | Yes | Yes | N/A | Yes |
Related information
System center
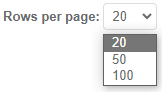
Edit the number of rows displayed
For most menu pages available in the Controller UI, you can display more or less rows in the table by selecting the number of rows to display.
-
Use the left-side Menu panel to display a specific page.
-
Scroll to the bottom of the selected page and edit the number of rows to display per page.
Use the search bar
The Search bar displays in pages with table displays.
-
Use the left-side Menu panel to display a specific page.
-
Enter one or several keywords in the Search bar to filter the table.
Search requirements:
- Keyword based
- No wildcard
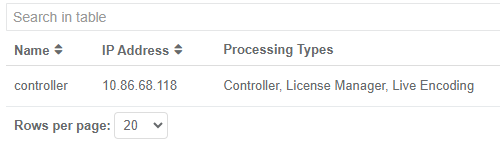 Example: Server page
Menus
Alarms
The Alarms menu is a link to a page that centralizes alarms and events. There are other types of alarm pages (services, failover, etc.) that show alarm information in a similar table display.
Related information
Manage alarms and events
Templates
Templates are saved service configurations. Templates simplify the creation of services that share common settings and ensure configuration consistency across services. This menu only displays if Live Encoder component is used.
You can edit any service configuration, even if the parameters were created from a template. Deleting a template has no impact on existing services created from that template. Configurations and parameters in templates vary per service type.
Related information
Create a service from a template
Failover
You can configure Failover settings and groups for redundant systems. Go to the Failover display table to view running states and alarm statuses.
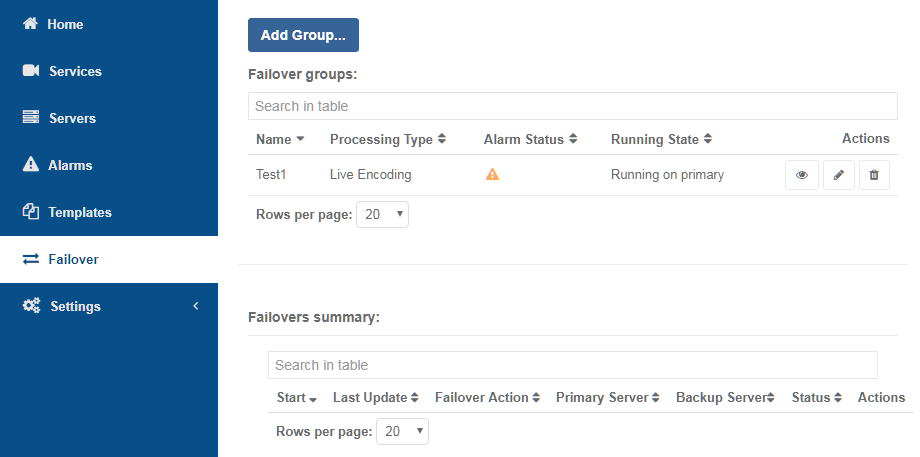
- All timestamps are in Universal Time (UTC) but you can customize them (see Alarm display time).
- To optimize performance, do not exceed 100 servers per failover group.
Related information
Manage failover
Reports
The reports menu provides access to specific information. You can export the report to a .csv file.
Menu displays vary depending on your product installation.
Settings
You can access additional menus from the Settings menu. This menu only displays if the Packager or Live Encoder components are used.
Related information
Service settings
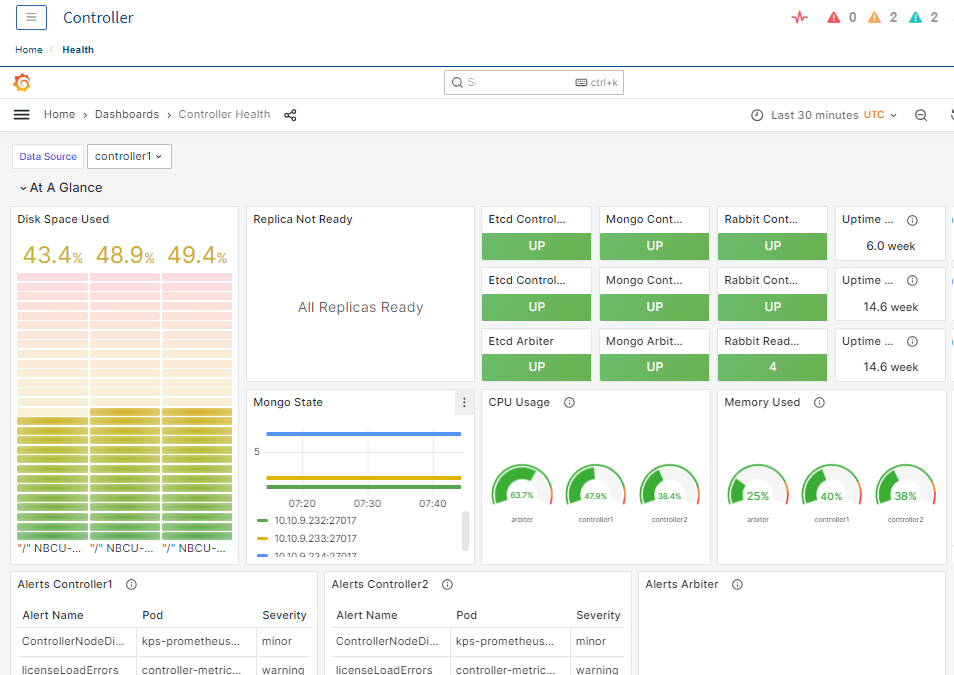
Health
The Controller utilizes Prometheus and Grafana to enhance monitoring capabilities. The Health page presents a dashboard with various indicators to effectively monitor your solution. This page will look different depending on the deployment type.
-
The At a glance section displays key indicators for the Controller framework and service health including Disk Space Used. Alarms are triggered at 60% disk space usage, with critical alarms at 90%. Health indicators are also provided for the key-value store (etcd), the database (Mongo) and the message queue (Rabbit), as well as uptime CPU, CPU and memory usage.
-
Details on any alerts raised by the Controllers are also shown.
-
Additional expandable indicators offer more detailed information for advanced troubleshooting.
At the top of the page, variables allow control over the displayed data. The Data source is particularly useful as it determines which Controller is used to serve the data.
External links to third-party tools
Access third-party tools directly from the Controller. Once added to the system, external links are available from the left side menu panel.